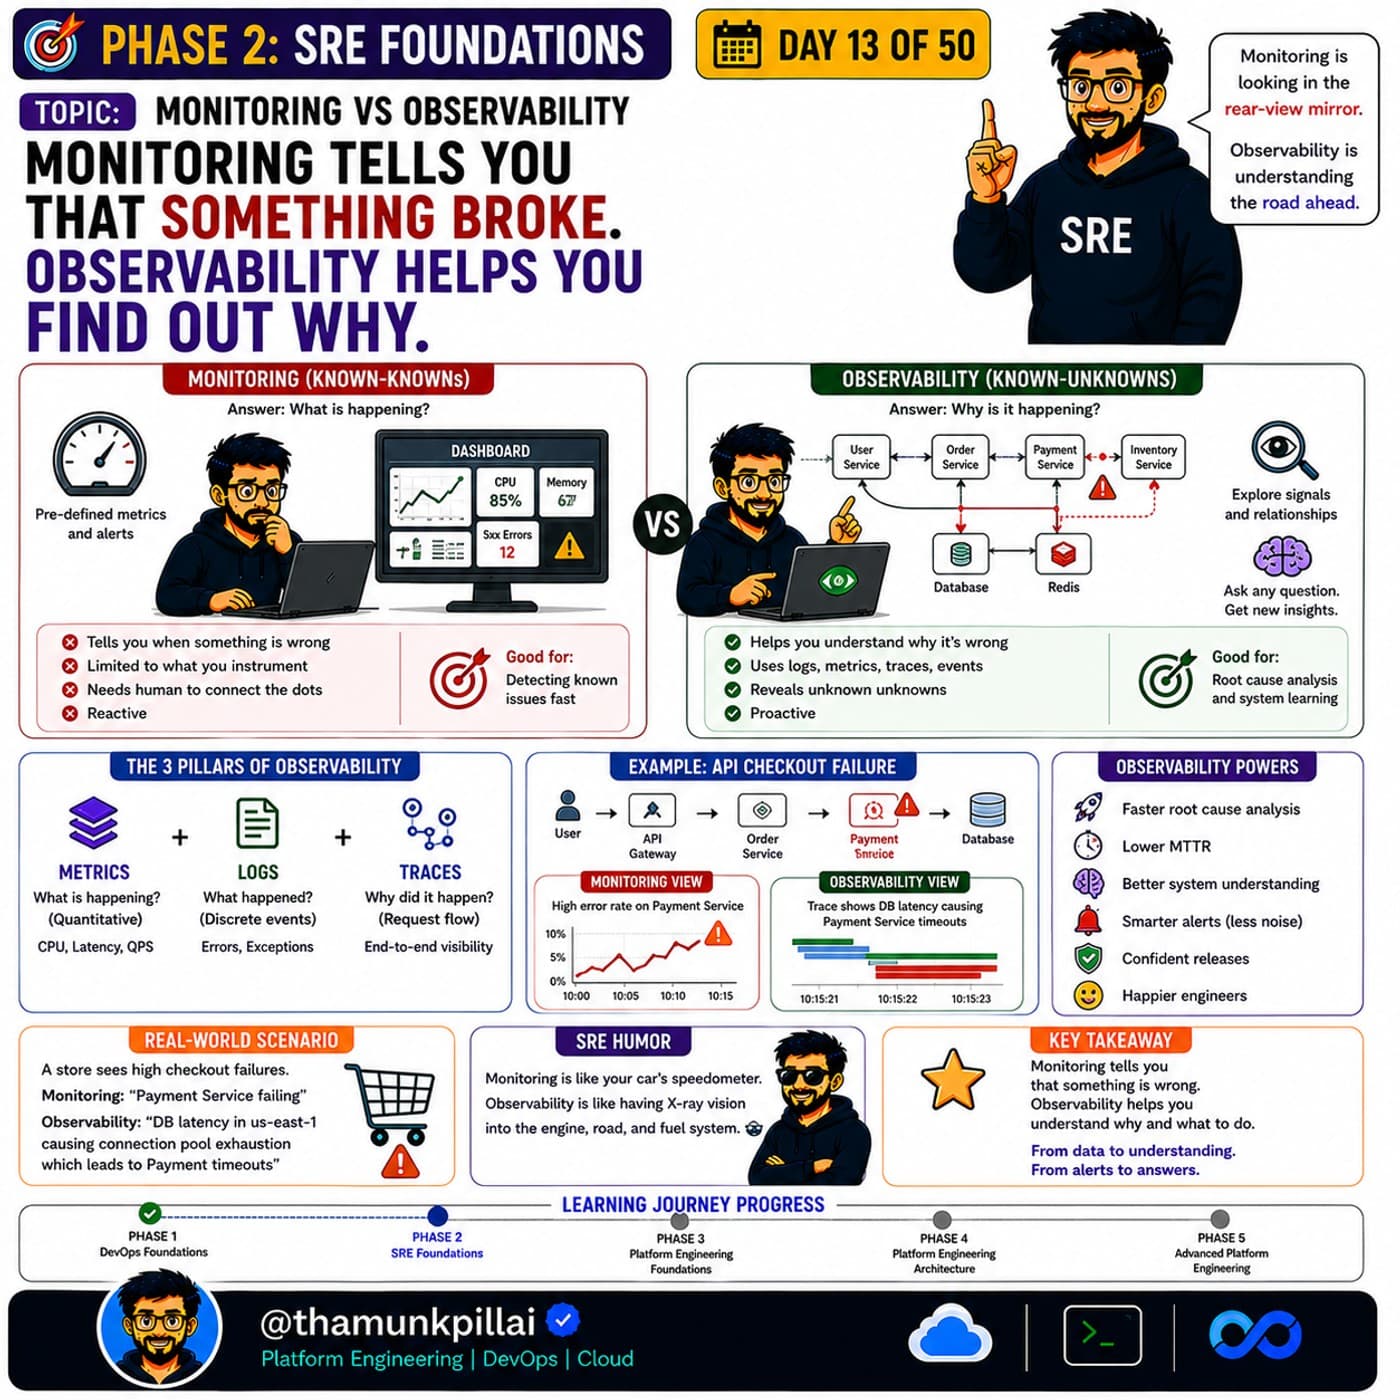
Day 13 of this series drew the line between monitoring and observability for applications: monitoring answers known questions, observability lets you ask new ones when the known questions don't cover what's actually happening. Day 31 put a platform API in front of everything the platform provides. The gap those two ideas leave open is the platform itself — the API layer, the CI/CD service, the provisioning pipeline — none of which are applications in the traditional sense, and all of which can fail silently unless someone deliberately instruments them the same way.
Note
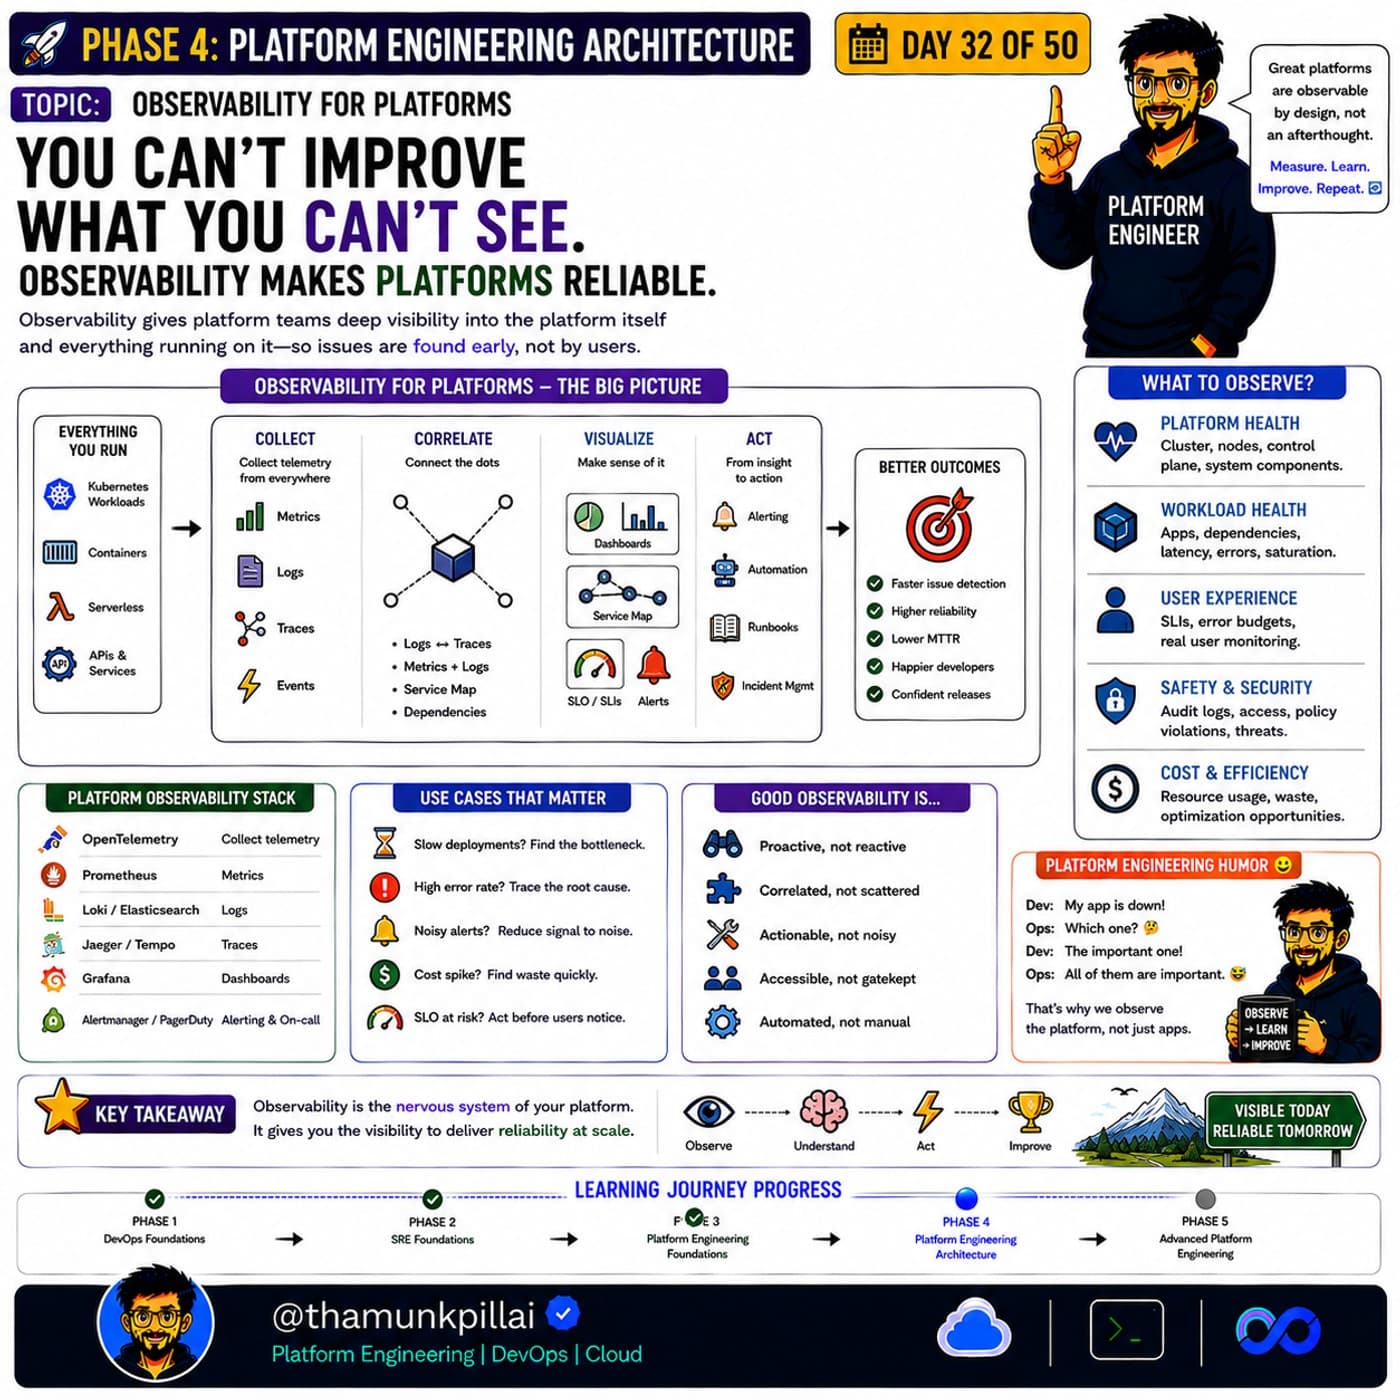
The one-sentence version: observability gives platform teams deep visibility into the platform itself and everything running on it, so issues are found early, by the platform team, not reported late, by a frustrated developer.
What actually needs watching, layer by layer
COLLECT     → metrics, logs, traces, events, from everywhere in the stack
CORRELATE   → connect the dots: logs ↔ traces, metrics + logs,
              service maps, dependency graphs
VISUALIZE   → dashboards, service maps, SLO/SLI views, alerts
ACT         → alerting, automation, runbooks, incident management
That pipeline is identical in shape to what Day 13 described for applications — the difference is what's being observed. A platform team isn't just watching whether a checkout service is slow; it's watching whether the self-service portal is responsive, whether the CI/CD pipeline is silently backing up, whether the provisioning API from Day 31 is meeting its own latency budget. The platform is a product with its own users (Day 21), and a product with users needs its own observability the same way any user-facing service does.
The five categories worth deliberately instrumenting
| Category | What to observe |
|---|---|
| Platform health | Cluster, nodes, control plane, core system components |
| Workload health | Applications, dependencies, latency, errors, saturation |
| User experience | SLIs, error budgets, real developer-facing monitoring |
| Safety & security | Audit logs, access patterns, policy violations, threats |
| Cost & efficiency | Resource usage, waste, optimization opportunities |
Most teams instrument the first two rows immediately — they're the obvious ones, and they map directly onto application observability practices most engineers already know. The last three get skipped far more often, and they're exactly the ones that turn into surprises: a security incident nobody caught because audit logs weren't correlated, a runaway cost nobody noticed because usage wasn't tracked, a platform that's "up" by every infrastructure metric while developers are quietly unhappy with how it feels to use.
What good platform observability actually looks like
Proactive, not reactive     — found before a user reports it
Correlated, not scattered   — one service map, not five disconnected dashboards
Actionable, not noisy       — an alert that tells you what to do, not just that something's wrong
Accessible, not gatekept    — any engineer can look, not just the platform team
Automated, not manual       — dashboards and alerts as code, versioned like everything else in this series
That last property connects directly back to Day 9's "everything as code" argument — dashboards and alert rules that live in a UI someone clicked together once are exactly as fragile as the undeclared infrastructure Day 9 warned about. Dashboards-as-code and alerts-as-code mean the platform's own observability gets the same review, versioning, and reproducibility as everything else in the stack.
The use cases that actually justify the investment
"Deployments are slow — find the bottleneck." "Error rate spiked — trace the root cause." "Alerts are noisy — reduce signal to noise." "Costs jumped — find the waste quickly." "An SLO is at risk — act before users notice." Every one of these is a question platform observability answers directly; without it, each becomes a multi-hour investigation across systems nobody's correlated.
Why this matters more, not less, as the platform succeeds
A platform with ten users generates ten users' worth of signal — manageable to watch informally. A platform with a thousand users, the outcome this series has been aiming at since Day 20, generates a thousand users' worth of signal, and informal watching stops working entirely. Observability is what lets a platform team stay ahead of problems at that scale instead of learning about them from a spike in support tickets. It's also, not coincidentally, the mechanism that makes Day 38's platform adoption metrics possible at all — you can't measure adoption, satisfaction, or reliability of something you have no visibility into.
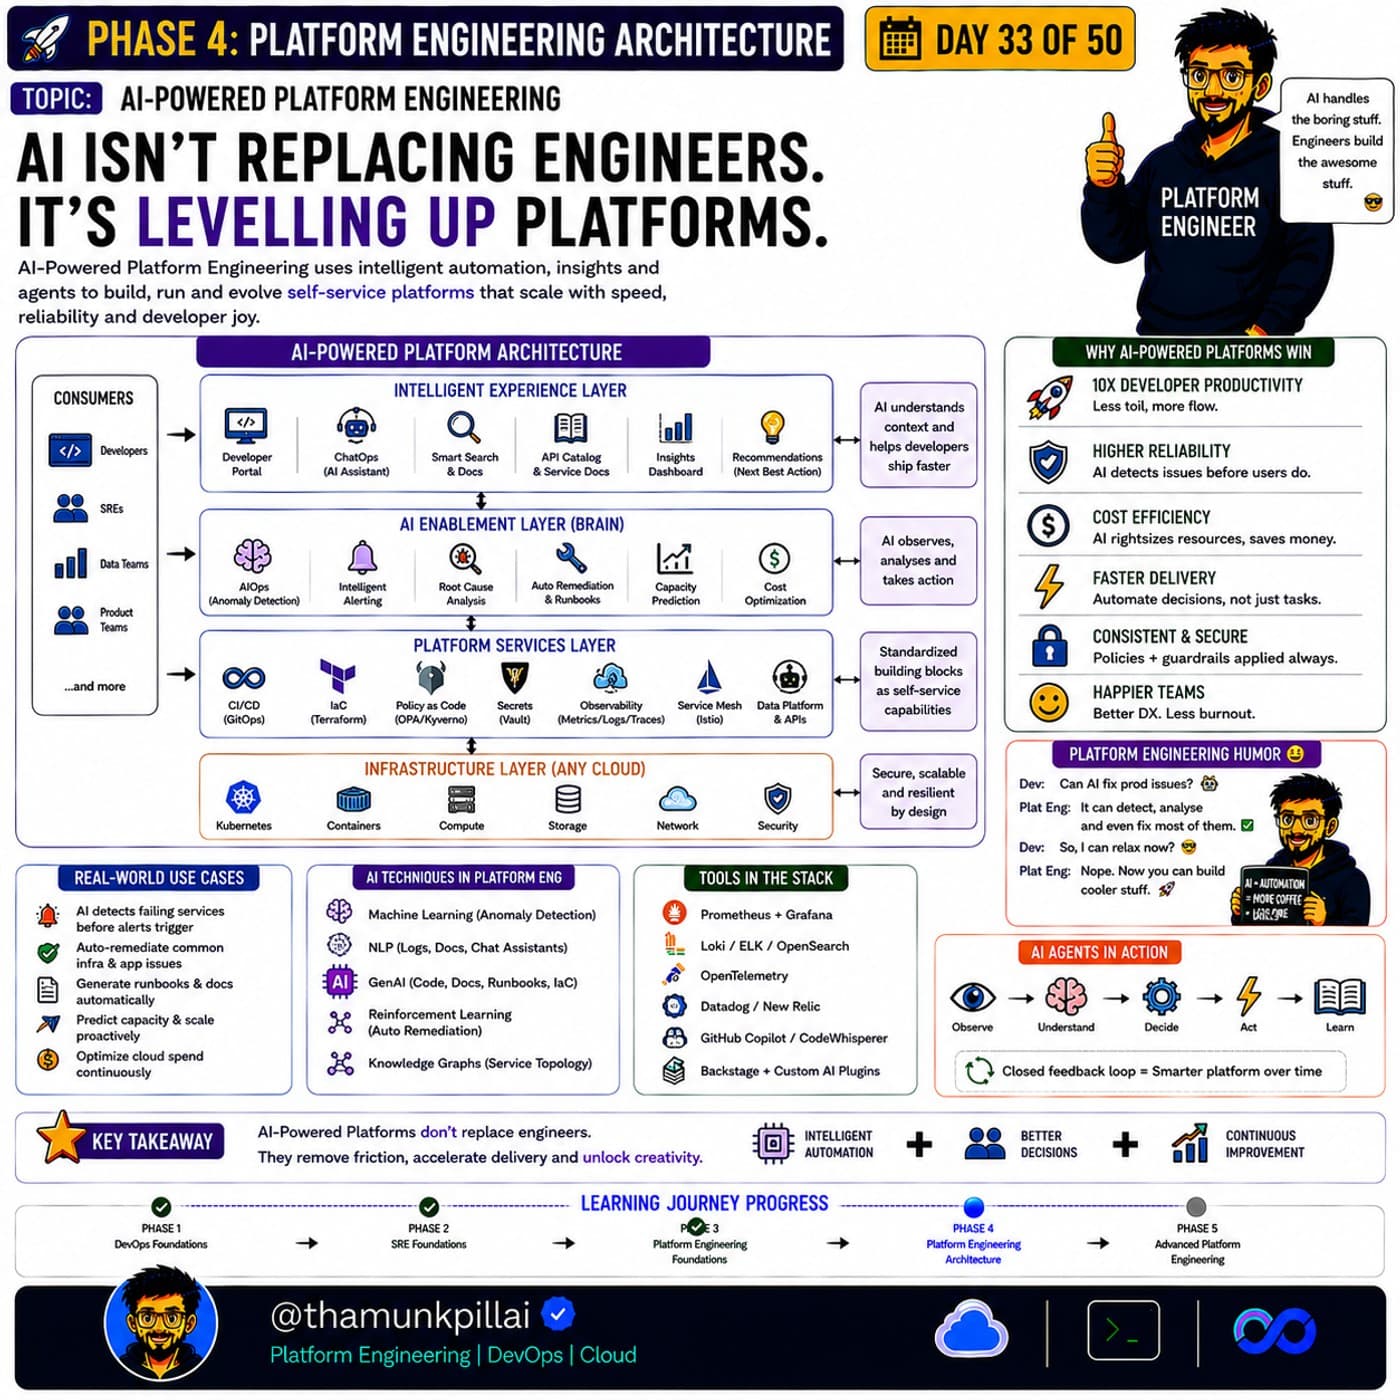
Tomorrow's article looks at what happens when a platform's own observability stack gets AI applied on top of it: not AI replacing the platform team, but AI-powered platform engineering — anomaly detection, automated root cause analysis, and remediation built on the exact telemetry this article just described.