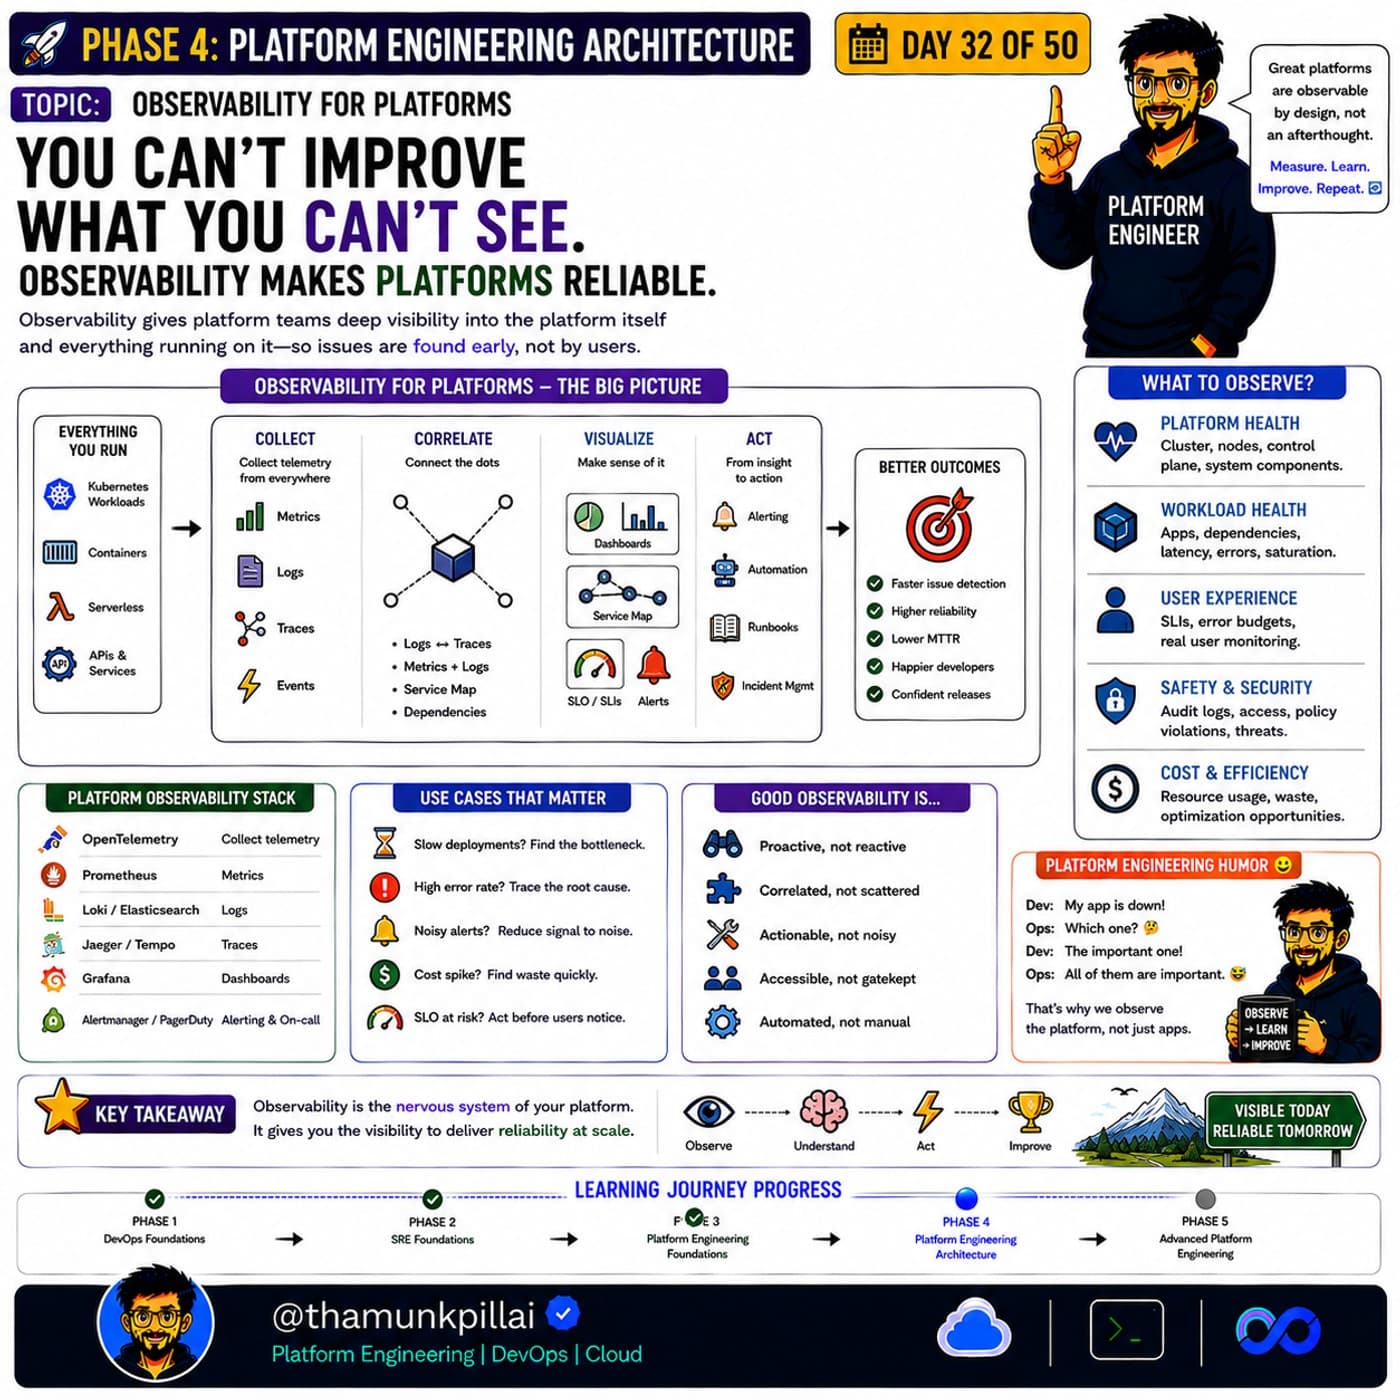
"We have monitoring, we're fine" is one of the most common last words before an incident nobody saw coming. It's not that the monitoring was broken — the dashboards were accurate, the metrics were real. It's that monitoring can only tell you about the specific things someone thought to watch in advance, and production has an unlimited supply of ways to fail that nobody thought to watch for.
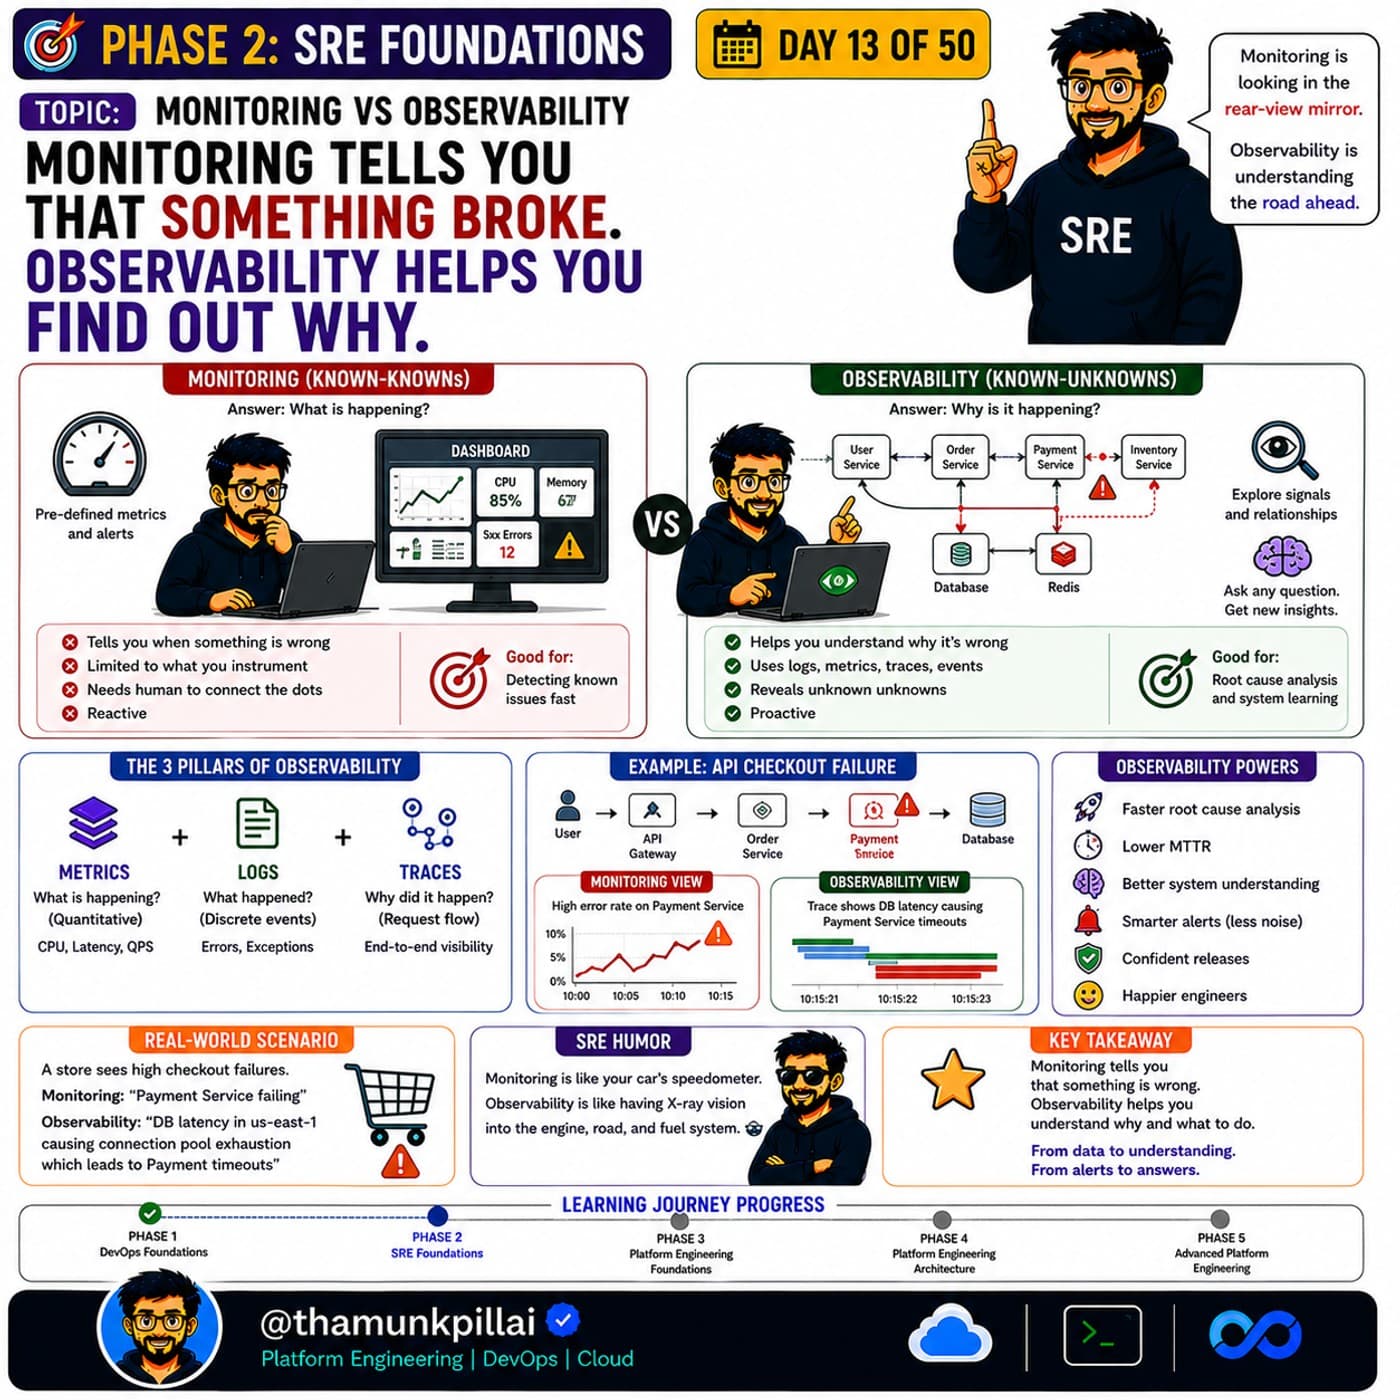
Monitoring answers known-knowns: is CPU high, is the error rate above threshold, is the queue backing up. You define the question ahead of time, and the dashboard tells you the answer. Observability is built for known-unknowns — and more importantly, unknown-unknowns: you don't know in advance what question you'll need to ask, so the system needs to let you ask any question, after the fact, using data you're already collecting.
Note
Monitoring is like a car's speedometer — it tells you exactly one thing, continuously, and tells it well. Observability is closer to having full diagnostic access to the engine, the fuel system, and the road ahead — you're not limited to the one number someone decided to put a gauge on.
The three pillars, and what each one is actually for
Observability isn't a product you buy, it's a property of a system built from three complementary data types:
- Metrics — quantitative, aggregated numbers: CPU, latency percentiles, requests per second. Cheap to store, great for "what's happening right now," bad at explaining causation.
- Logs — discrete, timestamped events: this specific request failed, this specific exception was thrown, with this specific stack trace. Rich detail, but volume makes them expensive to search without structure.
- Traces — the path a single request takes across every service it touches, with timing at each hop. This is the pillar most systems lack, and it's usually the one that actually answers "why."
User request → API Gateway → Order Service → Payment Service → Database
                  2ms            8ms              340ms ⚠️        4ms

Metrics say:  "Payment Service error rate is elevated."
Logs say:     "Payment Service: connection pool exhausted at 10:15:21."
Trace says:   "This specific slow request waited 340ms for a DB connection
              inside Payment Service — and every other slow request this
              hour shows the identical wait, at the identical step."
The metric told you something was wrong. The log told you what error occurred. Only the trace tells you where in the request's actual path the time went — and without it, "why is Payment Service slow" turns into guesswork across five different services and their five different dashboards.
A concrete example: monitoring alone versus observability
An e-commerce checkout starts failing. Here's what each capability actually tells the on-call engineer:
| Question | Monitoring answer | Observability answer |
|---|---|---|
| Is something wrong? | "Payment Service error rate: 12%, above threshold." | Same — this part monitoring does fine. |
| What's failing? | Unknown — you'd need to check logs manually, service by service. | "DB connection pool exhausted, traced to Payment Service → Database hop." |
| Why is it happening now? | No answer — the dashboard just shows red. | "Connection pool size hasn't scaled with a 3x traffic spike from the new campaign." |
| How do I fix it? | Guess, or start paging people. | Direct: raise the pool size or add read replicas — the trace already pointed at the bottleneck. |
Monitoring got the team to "something's wrong" in seconds. Getting from there to "here's the fix" is where the two approaches diverge hardest — and it's the gap that turns a 10-minute incident into a 90-minute one.
Where teams actually get value fastest
You don't need every pillar instrumented everywhere on day one. The highest-leverage starting point is usually distributed tracing across your 2-3 most critical request paths — checkout, login, whatever actually loses the business money when it's slow. Metrics and logs most teams already have; tracing is the pillar that turns "something's slow" into "here's exactly where."
Why this matters more as systems get more distributed
A monolith's failure modes are relatively contained — there's one process, one log stream, one thing to check. A system of a dozen microservices means a single slow checkout could be caused by any one of a dozen services, or the network between them, or a shared database three hops away from where the symptom showed up. Monitoring each service individually gives you a dozen green or red lights with no way to see the relationships between them. Observability — specifically tracing — is what lets you follow one request's actual path and find the one hop that's slow, instead of staring at a dozen dashboards and guessing.
This is also why observability tends to get real investment right around the same time platform engineering conversations start (day 18 of this series covers what triggers that): once a team has enough services that nobody can hold the whole system in their head, "can we see what's actually happening" stops being optional and starts being the thing that determines how fast every future incident gets resolved.